Today, We learn to create a pie chart without any library. This post will take you through how to do that using JavaScript, HTML Canvas, and CSS.
Pre-Requirements
- HTML
- CSS
- JavaScript
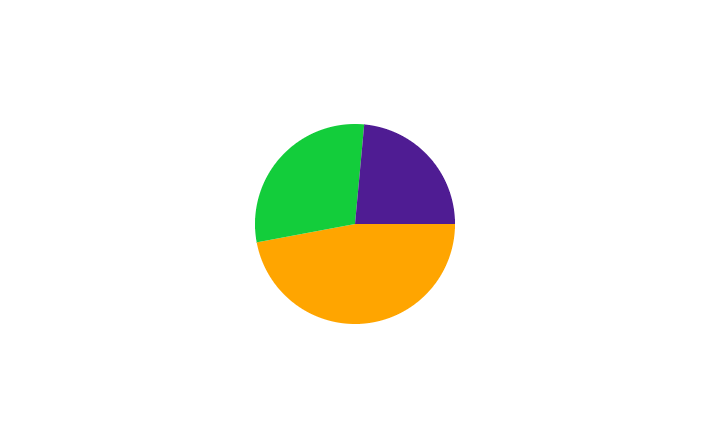
Create a pie chart full code:
<!DOCTYPE html>
<html>
<head>
    <title>canvas test</title>
    <style type="text/css">
        .pie_container{ width: 100%; height: 100vh; display: flex; justify-content: center; align-items: center;}
    </style>
</head>
<body>
<div class="pie_container">
<canvas width="200" height="200"></canvas>
</div>
</body>
<script>
    let ibctx = document.querySelector("canvas").getContext("2d");
    const dataChart = [
        {mood: "Angry", total: 32, shade: "orange"},
        {mood: "Happy", total: 20, shade: "#13cd3b"},
        {mood: "Melancholic", total:16, shade: "#4f1c93"}
    ];
    let sum = 0;
    let currentAngle = 0;
    let totalNumberOfPart = dataChart.reduce((sum, {total}) => sum + total, 0);

    for (let moodValue of dataChart) {
        let portionAngle = (moodValue.total / totalNumberOfPart) * 2 * Math.PI;
        ibctx.beginPath();
        ibctx.arc(100, 100, 100, currentAngle, currentAngle + portionAngle);
        currentAngle += portionAngle;
        ibctx.lineTo(100, 100);
        ibctx.fillStyle = moodValue.shade;
        ibctx.fill();
    }
</script></html>
lineTo()
This method is used to draw a straight line.
It is used together with the beginPath() and moveTo() to create a line.
arc()
We pass in the center’s x and y coordinates, the radius’ length, and the angles where the arc will start and where it will end.
Related Post Top 5 Hosting Providers In India